Home
Software
Prices
Download
Yahoo Charts
NEW:
ADVANCED
TRADESTATION TECHNIQUE
US Markets Daily
snapshots
Technical
Description
Divergences
Divergence is a comparison of price to a technical indicator. It can also be a comparison to another symbol or spread between two symbols. Divergence occurs when what you are comparing is moving in opposite directions. Divergence can signal an up coming change in trend, a change of trend in progress or that a trend should continue. A divergence signal suggests watching for a trading opportunity in the direction of the signal.
Divergences can be used on many indicators – Stochastic, MACD, XO4 to name a few. As with most indicators, divergence signals in a higher time frame (TF) are going to indicate a larger move in price.
There are 2 main types of divergences, Regular and Hidden and are found by comparing price to an oscillator. If you find them in price, but not in the oscillator, you have regular divergence. If you find them in the oscillator, but not in price, then it’s hidden divergence.
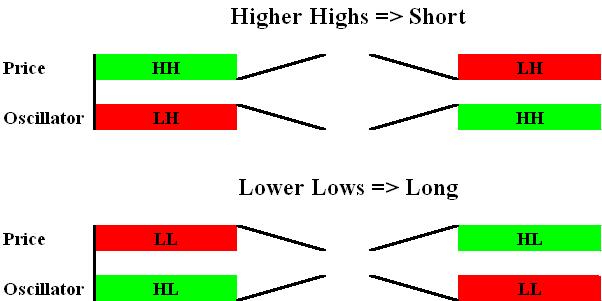
Higher Highs => Short
Lower Lows => Long
If the higher highs or lower lows are in price but not the oscillator, then the direction of price is likely to reverse. This is regular, or classic divergence and can be used as a confirming indicator for a reversal entry.
Regular divergence (RD) is best used at the test of a previous high or low. It is not uncommon to see 3 or 4 higher highs in price in an up trend with 3 or 4 lower highs in the indicator or 3 or 4 lower lows in price in a downtrend with 3 or 4 higher lows in the indicator. This is called 3pt RD or 4 pt RD. This is the indicator telling you with regular divergence that the trend is getting weak and the potential for a change of trend is there. Regular divergence describes a price trend change that will probably happen in the future, albeit shortly. On the other hand, hidden divergence is a confirming indicator of past price direction.
Another time to look for a divergence is after a period of consolidation or sideways movement in the market that also has a test of a previous high or low in the consolidation range.
Hidden divergence (HD) is best used in trends for continuation trades with the trend. A high percentage of hidden divergence trades will move at least to the last swing high/low, thereby giving you a way to calculate your risk/reward for the trade. If there isn’t enough points between the signal and the last swing high/low, then you can pass on the trade opportunity. Another warning to pass on the trade signalled by HD is having RD present for the last 3 highs in an up trend or last 3 lows in a downtrend which is thereby signalling a possible change of trend (COT).
As long as price is making higher highs and higher lows, that time frame is considered to be in an up trend. When price is making lower highs and lower lows, that time frame is considered to be in a downtrend.
Hidden divergence compares the higher lows (HL) of price in an up trend with the lower lows (LL) in the indicator and the lower highs (LH) of price in a downtrend with the higher highs (HH) of the indicator. Hidden divergence helps to answer the question of whether the trend is going to continue.
We have hidden divergence when we have higher highs or lower lows in the oscillator but not in price. In this case the direction indicated by higher highs or lower lows in the oscillator is contradicted by the price trend. Unlike regular divergence, where the weakness in price trend is about to lead to a reversal; here the weakness has already led to a little reversal against the trend. The hidden divergence implies that this recent little reversal in price direction will be short-lived and that price will resume moving in the direction of the trend. This is exciting because it can confirm a continuation entry, which is generally much less risky than a reversal entry. What you have here is the opportunity to enter on a pullback of the current trend, which you expect to continue based on this and whatever other indicators you choose. This is trading with the trend, nice and friendly; however, please heed the following warning.
Warning: I consider divergence to be an indicator, not a signal to enter a trade. It would be unwise to enter a trade basely solely on this indicator as too many false signals are given; however, on the other hand, I consider it even more unwise to trade against this indicator.
SUMMARY OF FOUR TYPES OF DIVERGENCE
Regular Divergence:
- Higher highs in price and lower highs in the oscillator which indicate a trend reversal from up to down.
- Lower lows in price and higher lows in the oscillator which indicate a trend reversal from down to up.
Hidden Divergence:
- Lower highs in price and higher highs in the oscillator which indicate a confirmation of the price trend which is down.
- Higher lows in price and lower lows in the oscillator which indicate a confirmation of the price trend which is up.
On the diagram, the diagonal lines represent the trend lines drawn on a chart showing how each of the four patterns look with price above and the oscillator below. On the two price lines, going either from right to left or left to right, the reversal of the diagonal lines shows the direction to be expected by each instance of divergence. In each of the four instances of divergence, when price is headed up, green, chances are good it will turn down, red, and vice versa.
Back to Trading General Observations