Home
Software
Prices
Download
Yahoo Charts
NEW:
ADVANCED
TRADESTATION TECHNIQUE
US Markets Daily
snapshots
Technical
Description
Patterns
Wedges:
The wedge formation is also similar to a symmetrical triangle in appearance, in that they have converging trend lines that come together at an apex. However, wedges are distinguished by a noticeable slant, either to the upside or to the downside. (As with triangles, volume should diminish during its formation and increase on its resolve.).
A falling wedge is generally considered bullish and is usually found in up trends. But they can also be found in downtrends as well. The implication however is still generally bullish. This pattern is marked by a series of lower tops and lower bottoms.
A rising wedge is generally considered bearish and is usually found in downtrends. They can be found in up trends too, but would still generally be regarded as bearish. Rising wedges put in a series of higher tops and higher bottoms.
Price Structure:
|
Pattern |
Structure |
Result |
|
Falling Wedge in Uptrend |
H, L, LH, LL, LH, LL |
Breakout to the Upside |
|
Falling Wedge in Downtrend |
L, H, LL, LH, LL |
Breakout to the Upside |
|
Rising Wedge in Uptrend |
H, L, HH, HL, HH |
Breakout to the Downside |
|
Rising Wedge in Downtrend |
L, H, HL, HH, HL, HH |
Breakout to the Downside |
Symmetrical Triangles:
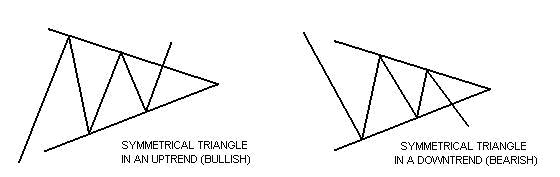
Symmetrical triangles can be characterized as areas of indecision. A market pauses and future direction is questioned. Typically, the forces of supply and demand at that moment are considered nearly equal. Attempts to push higher are quickly met by selling, while dips are seen as bargains. Each new lower top and higher bottom becomes more shallow than the last, taking on the shape of a sideways triangle. (It's interesting to note that there is a tendency for volume to diminish during this period.) Eventually, this indecision is met with resolve and usually explodes out of this formation (often on heavy volume.) Research has shown that symmetrical triangles overwhelmingly resolve themselves in the direction of the trend. With this in mind, symmetrical triangles in my opinion, are great patterns to use and should be traded as continuation patterns.
Price Structure:
|
Pattern |
Structure |
Result |
|
Symmetrical Triangle in Uptrend |
H, L, LH, LL |
Breakout to the Upside |
|
Symmetrical Triangle in Downtrend |
L, H, LL, LH |
Breakout to the Downside |
Ascending Triangles:
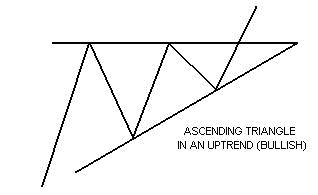
The ascending triangle is a variation of the symmetrical triangle. Ascending triangles are generally considered bullish and are most reliable when found in an uptrend. The top part of the triangle appears flat, while the bottom part of the triangle has an upward slant. In ascending triangles, the market becomes overbought and prices are turned back. Buying then re-enters the market and prices soon reach their old highs, where they are once again turned back. Buying then resurfaces, although at a higher level than before. Prices eventually break through the old highs and are propelled even higher as new buying comes in. (As in the case of the symmetrical triangle, the breakout is generally accompanied by a marked increase in volume.)
Price Structure:
|
Pattern |
Structure |
Result |
|
Ascending Triangle in Uptrend |
H, L, H, HL |
Breakout to the Upside |
Descending Triangles:
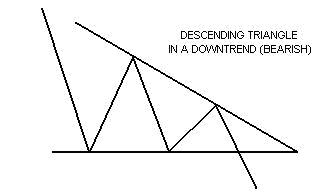
The descending triangle, also a variation of the symmetrical triangle, is generally considered to be bearish and is usually found in downtrends. Unlike the ascending triangle, this time the bottom part of the triangle appears flat. The top part of the triangle has a downward slant. Prices drop to a point where they are oversold. Tentative buying comes in at the lows, and prices perk up. The higher price however attracts more sellers and prices re-test the old lows. Buyers then once again tentatively re-enter the market. The better prices though, once again attract even more selling. Sellers are now in control and push through the old lows of this pattern, while the previous buyers rush to dump their positions. (And like the symmetrical triangle and the ascending triangle, volume tends to diminish during the formation of the pattern with an increase in volume on its resolve.)
Price Structure:
|
Pattern |
Structure |
Result |
|
Descending Triangle in Uptrend |
L, H, L, LH |
Breakout to the Downside |
Flags and Pennants:
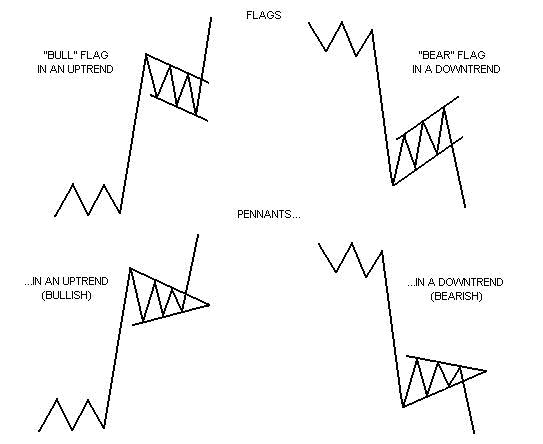
Flags and pennants can be categorized as continuation patterns. They usually represent only brief pauses in a dynamic market. They are typically seen right after a big, quick move. The market then usually takes off again in the same direction. Research has shown that these patterns are some of the most reliable continuation patterns.
Bullish flags are characterized by lower tops and lower bottoms, with the pattern slanting against the trend. But unlike wedges, their trend lines run parallel.
Bearish flags are comprised of higher tops and higher bottoms. "Bear" flags also have a tendency to slope against the trend. Their trend lines run parallel as well.
Pennants look very much like symmetrical triangles but are typically smaller in size (volatility) and duration.
(Volume generally contracts
during the pause with an increase on the breakout.)
Rectangles:
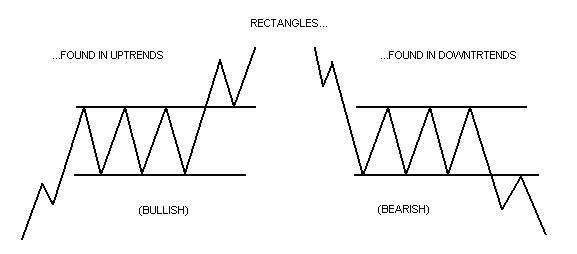
Rectangles should generally be traded as continuation patterns. They are indecision areas that are usually resolved in the direction of the trend. Research has shown that this is true far more often than not. Of course, the trendlines run parallel in a rectangle. Supply and demand seems evenly balanced at the moment. Buyers and sellers also seem equally matched. The same 'highs' are constantly tested as are the same 'lows'. The market vacillates between two clearly set parameters. (While volume doesn't seem to suffer like it does in other patterns, there usually is a lessening of activity within the pattern. But like the others, volume should noticeably increase on the breakout.)
Head and Shoulders:
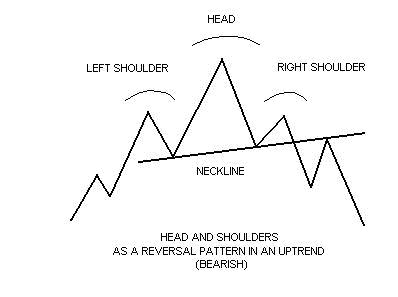
The head and shoulders pattern is generally regarded as a reversal pattern and it is most often seen in uptrends. It is also most reliable when found in an uptrend as well. Eventually, the market begins to slow down and the forces of supply and demand are generally considered in balance. Sellers come in at the highs (left shoulder) and the downside is probed (beginning neckline.) Buyers soon return to the market and ultimately push through to new highs (head.) However, the new highs are quickly turned back and the downside is tested again (continuing neckline.) Tentative buying re-emerges and the market rallies once more, but fails to take out the previous high. (This last top is considered the right shoulder.) Buying dries up and the market tests the downside yet again. Your trendline for this pattern should be drawn from the beginning neckline to the continuing neckline. (Volume has a greater importance in the head and shoulders pattern in comparison to other patterns. Volume generally follows the price higher on the left shoulder. However, the head is formed on diminished volume indicating the buyers aren't as aggressive as they once were. And on the last rallying attempt-the left shoulder-volume is even lighter than on the head, signalling that the buyers may have exhausted themselves.) New selling comes in and previous buyers get out. The pattern is complete when the market breaks the neckline. (Volume should increase on the breakout.)
Inverted Head and Shoulders:
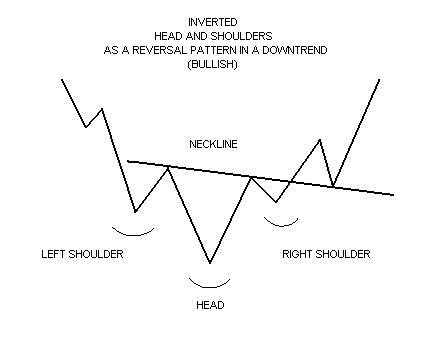
The head and shoulders pattern can sometimes be inverted. The inverted head and shoulders is typically seen in downtrends. (What's noteworthy about the inverted head and shoulders is the volume aspect. The inverted left shoulder should be accompanied by an increase in volume. The inverted head should be made on lighter volume. The rally from the head however, should show greater volume than the rally from the left shoulder. Ultimately, the inverted right shoulder should register the lightest volume of all. When the market then rallies through the neckline, a big increase in volume should be seen.)