|
Home
Software
Prices
Download
Yahoo Charts
NEW:
ADVANCED
TRADESTATION TECHNIQUE
US Markets Daily
snapshots
Technical
Description
| |
|
(a LOT more details and updates on our
blogs)
 NEW:
Google Group now also open
for discussion on TS-TT. |
ShoutMix
|
Foreword... or my critical Words of Wisdom... yes, all
this for free...
The technique outlined below is in the current version suitable for discretionary traders
(cf. links on left side of this page).
It
is based on a fairly complex data analysis which has been translated into a set
of proprietary tools. Before describing these tools, we feel it is
important to have these first guidelines in mind, gathered along nearly 15
years of experience:
- Most indicators, either custom made or built in trading platforms, do
calculate one or several mathematical outputs at each bar. One may
also (correctly) say
that prices are noisy, chaotic in nature, which obviously make "market reading"
rather difficult.
However, in my opinion, the problem is elsewhere... Indeed, most of
the time, there is simply nothing to read in the market, not
necessarily noise, but just irrelevant useless information. To be quite
pragmatic about it, let's say that buying and selling are essentially discrete decision
points, the rest is 'vacuity' which should be handled by money
management, i.e. keeping an eye on your position.
Trading should therefore always inherently remain dependent on an event driven
technique. In other words, if you wish to crunch large amount of
numbers in any crude or sophisticated way, irrespective of the rare salient
events where effective decision making is only sensible, well... you might
just be wasting your time... and LOTS of so-called trading gurus are
quite willing to take you for a ride along the meanders of the never ending
quest of the Holy Grail...
(note: LOTS is still a huge understatement...)
- Any sound decision can only make sense in perspective or context, unless
you stick to quick scalping or to the simplest reversal strategy, assuming
you get your pivot calculations right too.
The best way to represent context is
to work in a multi-time frame environment (2, 3 or even 4 time frames). It seems obvious that a
move in your time frame of choice, determined by indicators lining up nicely
either long or short, can only show strength if supported by a similar
set-up in a higher time frame. Choice of adequate time frames may
however not always be easy, and one could only hope for a trading platform
in the future which would have adaptive bar intervals.
It may be interesting to have up to 6 time frames available, of which 3 will
be selected for trading at each point in time.
For synch purposes, time frames will often
be in multiples like 1, 2, 4, 8 minutes. In addition, some will prefer finding
confirmation from 2 or more higher time frames. Others may find more
suitable to balance their time frame analysis with one higher and one lower
time frame. It is likely that using a conservative rule base over 4
time frames can reduce trading ambiguity to next to zero. The trader's
risk adverseness is key here as he/she will have to devise a rule set based
on indicators confirming each other on different time frames making trading
as comfortable as possible.
- There are always times of congestion, relative market inactivity, which
will inevitably affect indicator calculations. One way to reduce such
impact on indicator reading is to opt for tick charts or volume charts, or
alternative market representations like Renko charts. Congestion on a
time frame should indicate going higher or lower. Most traders will
try and go to a lower time frame to detect waves or cycles he/she can trade.
It is however on the contrary often recommended to go higher, or even better
go both higher for context, and lower for trading points.
- Markets are highly dynamic. Prices are chaotic, non stationary
etc... Still, this is no reason to try and throw everything but the kitchen
sink into your favorite trading platform. Do not forget to still be
able to fully understand the method you are trying to put together... You
are the trader... don't ever forget this subtle point. Successful
traders always know the finest details in trading calculations.
Do not underestimate 2 things however: stats will be in most cases wrong as
they do imply stationarity that is just not there. This is why most
statistics based system use walk-forward methods. This is to me the "Look
Ma, no hands..." syndrom i.e. how long before i fall off the bike... Secondly, many many
'market cycles' gurus will find cycles in a market that cannot produce any
stable cycles (NB: cycles not in layman's terms but in physics terms of sine
waves). One way to put it is that if you look hard enough, and
with a bit of faith, you'll always find what you are looking for. It is a
common mental process distortion.
- Markets are inherently chaotic and
do contain fractal features. Once you have
found a sound technique, it should work the same on another set of time
frames, as well as on other financial instruments. This is the
absolute 'acid
test'. Many models just fit one instrument on a single time frame, and
are bound to fail sooner or later. There may of course be some
adjustments needed (not more than a few degrees of freedom if possible) to
adapt from one instrument to the next, but not more than that.
- I personally do not use
astrology, lunar cycles, solar eruptions etc... I am not going to debate
on Darwinism, the Big Bang or other esoteric sources either. Some say
trading is more art than science too... Scientists like me would rather say
there is still some unexplained fuzziness in markets, a LOT of unknown stuff
in Nature, and that's much better that way... we, humans are so big headed
already... so please always stay humble...
These forewords may sound like vague generalities, and
there are admittedly many ways to spoil a cat (I love cats so I had to twist
that horrible expression), but they can be a
crucial time saver to you in the end, and most important may prevent you from
wandering around lots of trading costly dead-ends...
Essential Tools
- A prerequisite to trading in my opinion is some knowledge of
Fibonacci
numbers, and in that respect, I can for instance recommend reading Jo DiNapoli's books. Most traders calculate
Fib retracement and expansion
numbers. There is more to it, and I may write about it at some point, although there
is already ample literature on the Internet. Be careful though not to
be too 'trigger-happy', Fib is no panacea. It also fails!
- Another very interesting calculation tool is the
Murray Math Lines
algorithms. It is still a proprietary algorithm, I believe, but it has
however been mimicked and rewritten for most platforms nowadays. We of course have
our own. A *FREE* VBA version of the algorithm is freely available on a
MS Excel
spreadsheet (updated!) on this site. Some also use
static support resistance levels (based on previous day's mid price etc), as
well as swing highs and lows. All contribute to an extent, and do
provide an interesting basis for pivot detection.
- Adaptive indicators which calculate OK in a multi-time frame environment, such as
stochastic indicators. Stochastics have that annoying tendancy to respond to
a fairly narrow bandwidth. Try and make them as adaptive as you can,
and when they lose efficiency, just jump time frames. Ideally, one
would want a chart built on the fly with flexible bar interval to suit the
indicators and not the other way around. This is unfortunately too advanced
for commercial charting software.
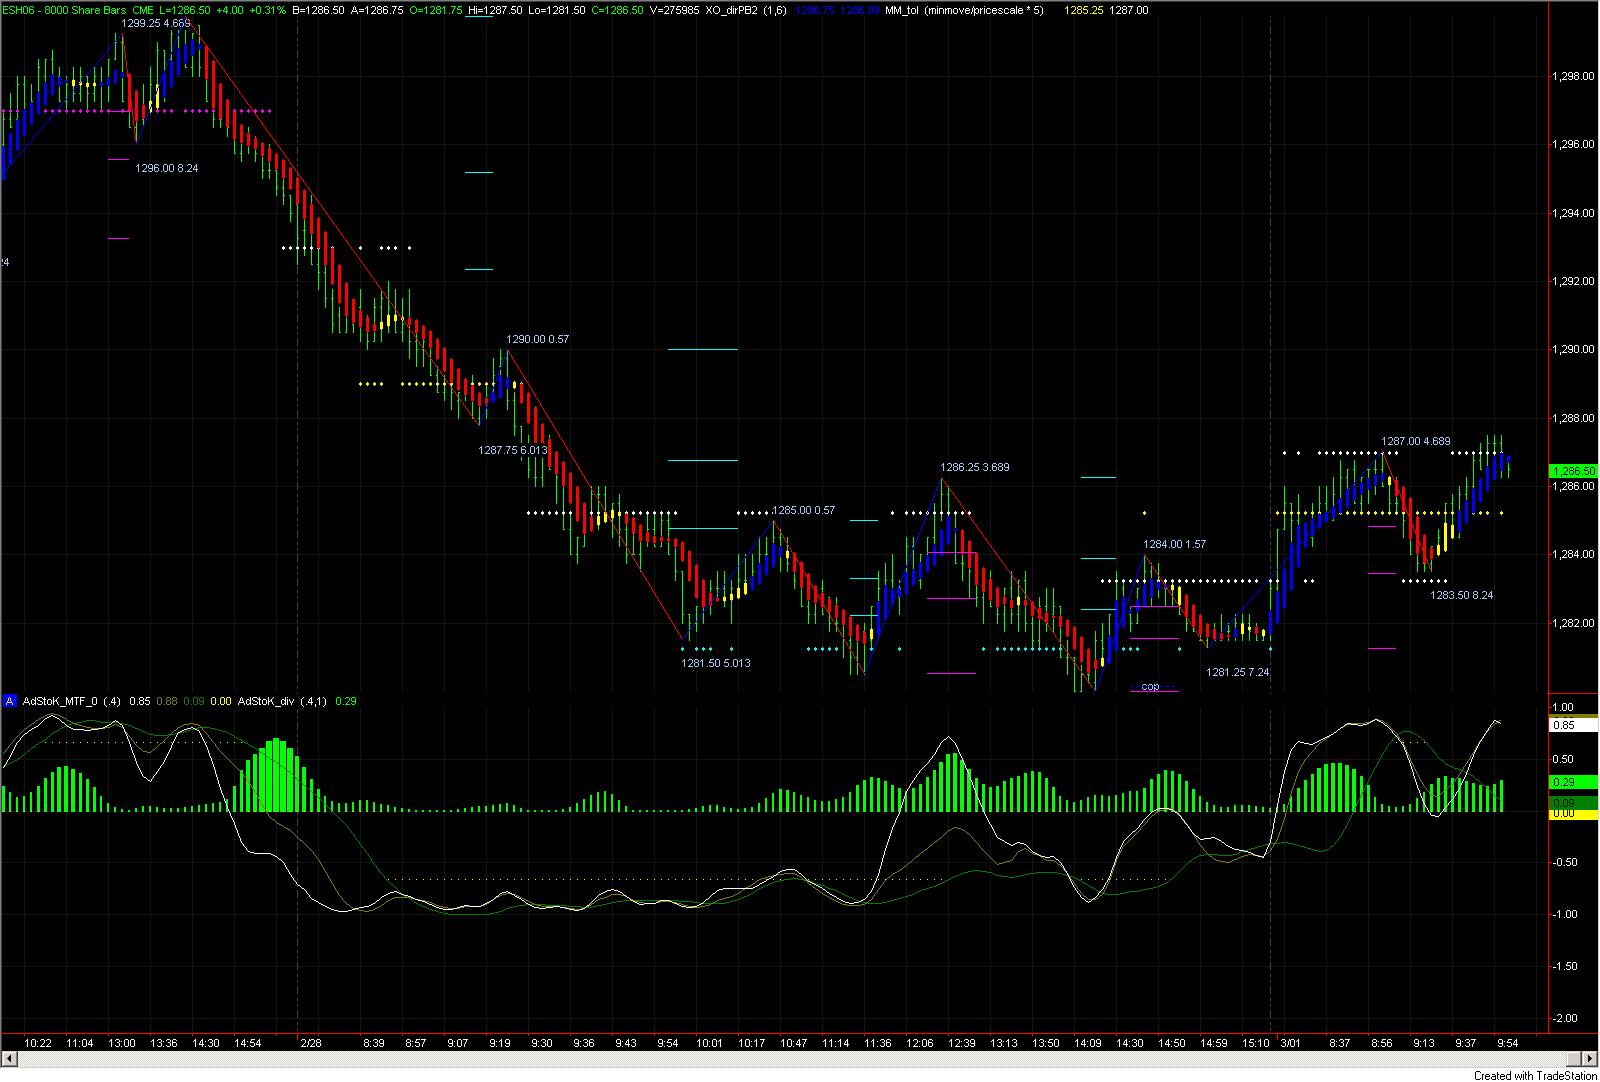
- Get yourself a good pivot algorithm. It may at
first look like just another display method for swing analysis, but there is
more under the bonnet... Pivot sequences (in 2 or more time frames) can be
used to derive waves, and can be used with advanced artificial intelligence
algorithms to detect the next pivot hence patterns with sometimes very high probability. We
also use a numbering scheme (pivot classification somewhat remotely inspired by
Clyde Lee) Here is a
TradeStation screenshot (ES e-mini 8000V) and some
chart commentary here for your perusal.
Toolset Availability:
Our
TradeStation indicator toolset is
only available
for selected users only on a trial basis (with personal training... no mass
marketing here).
After the trial period, quarterly license can be purchased from US$500/quarter
upward, including personal
support (email / skype). Market advice can also be provided to
professionals, along the same line as our
MarketSnapshot service
(more symbols, more details).
Note: Each license is discussed individually. Trial users are however not
guaranteed access to the DLL after the trial period. Contact me for
details.
Where to find
more information
There is no available documentation as such yet, the main reason being that nobody ever
reads docs but also because this is a discretionary trading technique which I
believe requires "absorbing and digesting it slowly until you make it your own".
This is why customers are always "coached" individually.
I have however written an internal draft document for the V1 toolset which describes
underlying concepts that are still valid:
BV_TSINDS.PDF, and published a
number of
articles on a dedicated blog:
TS-TRADING-TECHNIQUE.
Prospective users are also invited to follow the free commentaries on the
MarketSnapshot blog.
(RSS:
)
You can also find some additional reading
here on this site.
Feedback / Contact
For more info or feedback (always welcome), please contact us by email at
Support@ForeTrade.com or Skype.
|